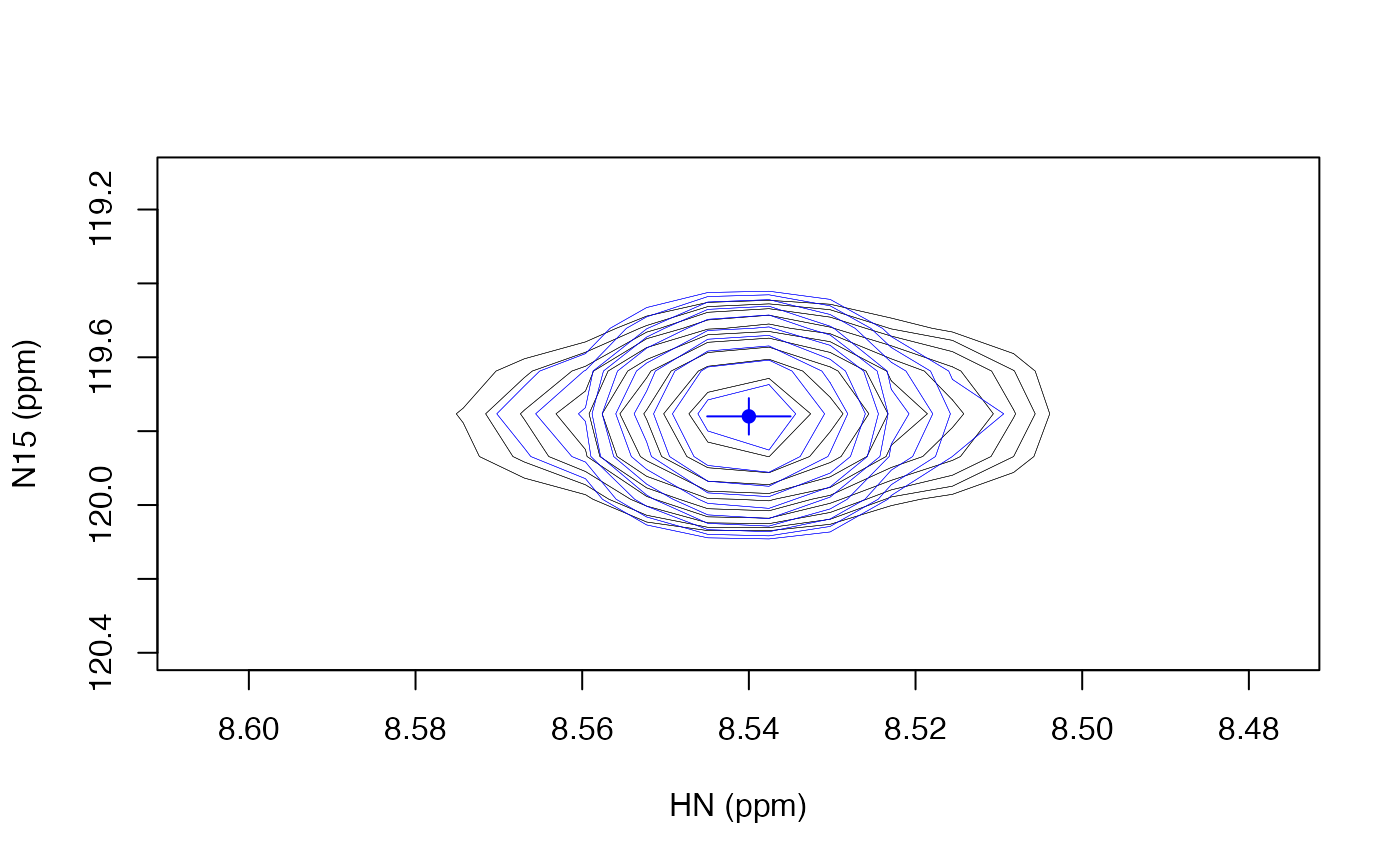
Plot a two dimensional peak fit
Usage
plot_fit_2d(
  fit_output,
  spec_ord = seq_len(dim(fit_output$start_list$omega0)[1]),
  always_show_start = FALSE,
  main = NULL
)
Arguments
- fit_output
fit_output structure
- spec_ord
order of spectral dimensions to plot
- always_show_start
logical indicating whether to show starting model when fit is present
- main
optional title for the plot
Value
No return value, called for side effects (draws plots).
Examples
spec_file <- system.file("extdata", "t1", "1.ft2", package = "fitnmr")
spec <- read_nmrpipe(spec_file, dim_order = "hx")
fit_input <- make_fit_input(
  list(spec),
  omega0_start = matrix(c(8.5400, 119.76), nrow = 2),
  omega0_plus = c(0.075, 0.75),
  r2_start = 4,
  m0_start = 1e9
)
plot_fit_2d(fit_input)